EOG Resources turns higher production into US$6.5 billion of free cash flow

EOG Resources posted a stronger third quarter, with production reaching 1.433 million barrels of oil equivalent per day and year-to-date free cash flow rising to US$6.468 billion. Lower net leverage and continued shareholder returns add to the appeal, although the company remains exposed to volatile oil and gas prices.
- US$2.781 billion third-quarter GAAP net income
- 1.433 million barrels of oil equivalent per day produced
- US$6.468 billion year-to-date non-GAAP free cash flow
- Net debt-to-capitalisation ratio improved to 6.2%
- US$2.780 billion spent on share repurchases year to date

 Add us as a preferred source on Google
EOG Resources, Inc. (NYSE:EOG) generated US$2.781 billion in third-quarter net income as production rose to 1.433 million barrels of oil equivalent per day, putting the US producer on a stronger operational footing heading into the final quarter of 2026. Diluted GAAP earnings were US$5.33 a share, up from US$2.70 in the same quarter a year earlier, while operating revenue reached US$8.549 billion.
Production reaches 1.433 million barrels of oil equivalent per day
Total production was 131.8 million barrels of oil equivalent for the quarter, compared with 119.7 million a year earlier. Crude oil and condensate output rose to 550.4 thousand barrels per day, natural gas liquids reached 357.1 thousand barrels per day and natural gas production climbed to 3.153 billion cubic feet per day.
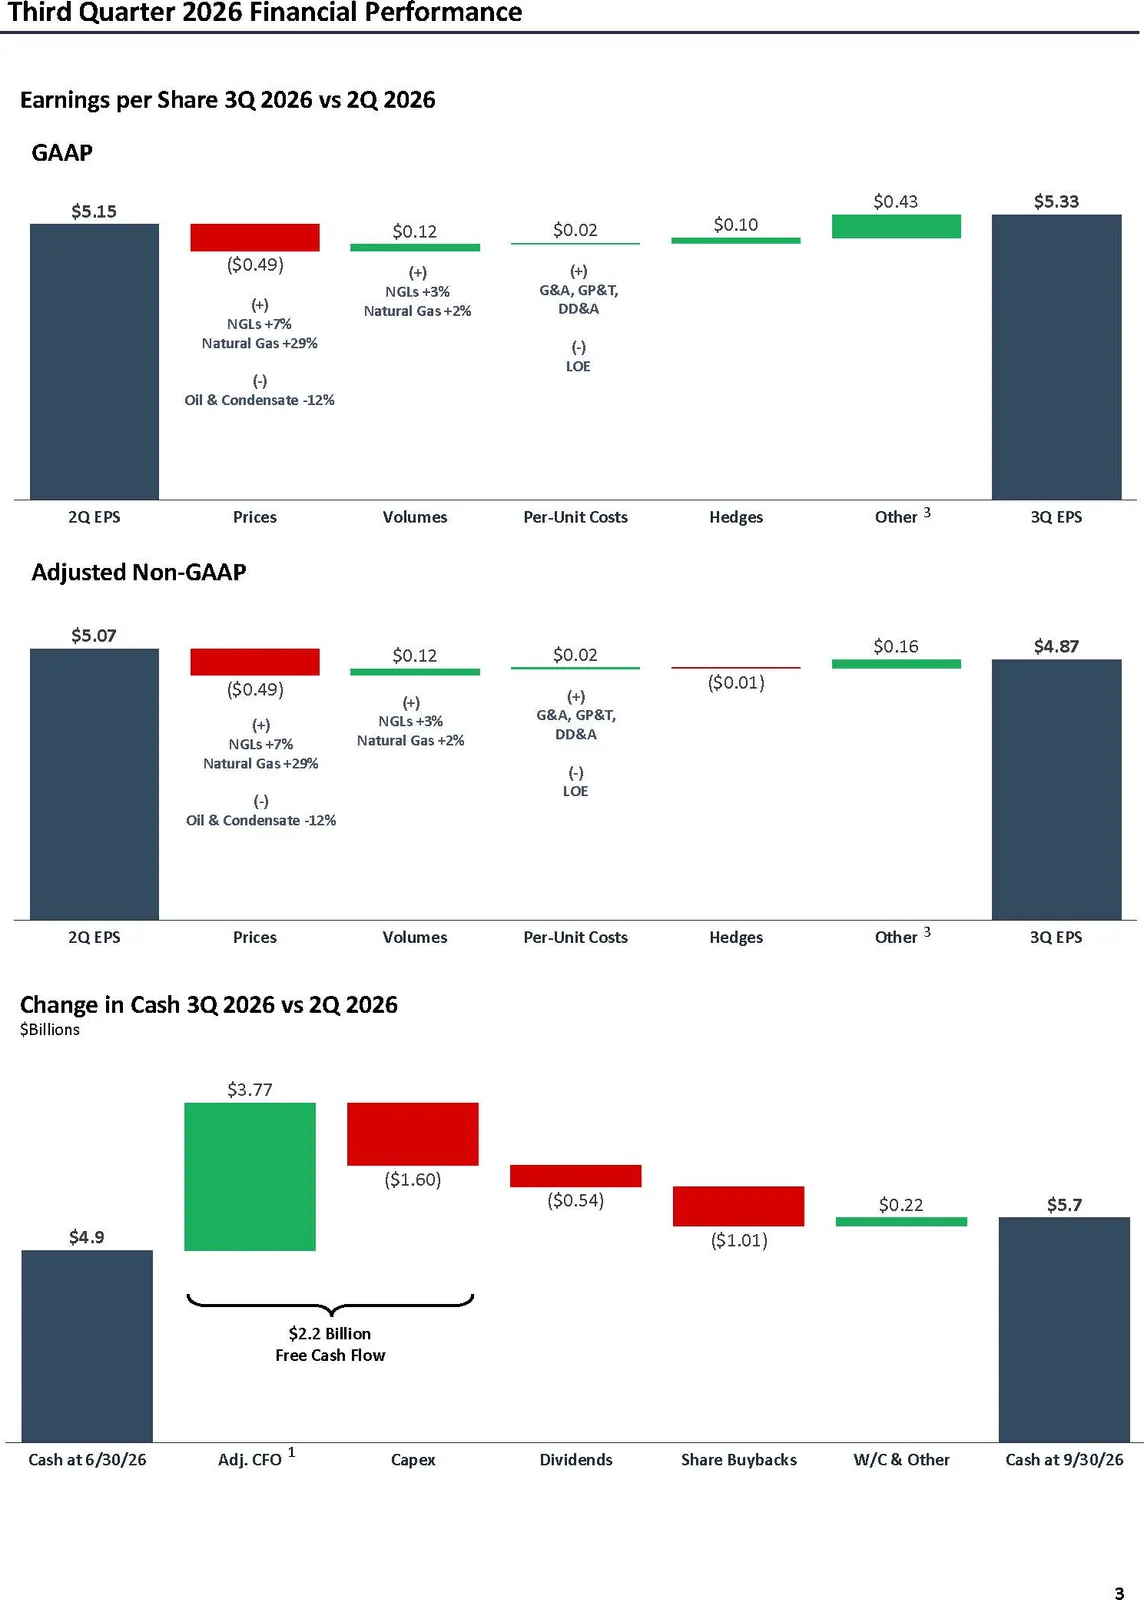
The improvement came despite a softer quarter-on-quarter realised oil price. EOG’s composite crude oil and condensate price fell to US$86.72 a barrel from US$98.15 in the second quarter, while its US natural gas price increased to US$3.73 per thousand cubic feet from US$2.77. Revenue from crude oil, natural gas liquids and natural gas was US$6.335 billion, down from US$6.483 billion in the June quarter but well above the US$4.554 billion recorded a year earlier.
Free cash flow funds buybacks and dividends
EOG reported US$3.813 billion in GAAP operating cash flow for the third quarter and US$2.176 billion in non-GAAP free cash flow. For the first nine months, free cash flow reached US$6.468 billion, while capital expenditure on the company’s non-GAAP measure totalled US$4.820 billion.
Capital returns remained substantial. EOG paid US$1.628 billion in dividends during the first nine months and spent US$2.780 billion buying back stock. The average diluted share count fell to 522 million in the third quarter, from 544 million a year earlier, although the filing does not identify how much of the earnings-per-share increase resulted from repurchases.
Net leverage falls to 6.2% of capitalisation
The balance sheet also improved. EOG held US$5.747 billion in cash against US$7.922 billion of current and long-term debt at 30 September, leaving non-GAAP net debt of US$2.175 billion. Net debt-to-total capitalisation declined to 6.2%, from 8.7% at June and 13.2% at the end of 2025.
EOG’s adjusted net income, a non-GAAP measure, was US$2.540 billion, or US$4.87 a diluted share. The reconciliation removed US$82 million after tax related to net gains on mark-to-market commodity derivatives and US$191 million after tax from asset-disposition gains. The GAAP result remains the primary reported figure, and the adjustments highlight how commodity instruments and asset sales affected the quarter.
Fourth-quarter pricing assumptions remain the next test
The release also contains fourth-quarter and full-year 2026 forecasts, including benchmark commodity pricing information, but the detailed forecast tables were not available in the extracted filing text. That limits what can be established here about planned production, spending or the company’s assumed oil and gas prices.
For shareholders, the key tension is clear enough: EOG is producing more, generating large amounts of cash and carrying less net debt, but its realised prices remain the major swing factor. The next meaningful read-through will be whether the company’s fourth-quarter assumptions support continued buybacks and dividends without compromising production investment.
Get NYSE:EOG news the moment it breaks
 iPhone & iPad
 Android
Bottom Line?
EOG enters the final quarter with stronger production, US$6.468 billion of year-to-date free cash flow and lower net leverage, but the durability of those returns still depends heavily on commodity prices.
Questions in the middle?
- What production and capital-spending levels does EOG forecast for the fourth quarter and full year?
- Can the company sustain its buyback pace if oil and gas prices weaken?
- How much of the earnings-per-share improvement will persist once share repurchase effects and commodity-price movements are separated?
Sources
1-
Results of Operations and Financial Condition; Regulation FD Disclosure (opens in a new tab)Official market announcement. SEC filing · EOG Resources, Inc. · 5 Nov 2026 · sec.gov